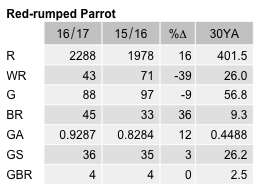
Red-rumped Parrot
Psephotus haematonotus
ABR description
The following is extracted from the Annual Bird Report for the twelve months to June 2017.
Common, breeding resident
Often seen on the short grasses of Canberra’s playing fields and nature reserves.
General: Reported in all months (22% in spring, 37% in summer, 24% autumn, 17% in winter) with a reporting rate of 16.6%, 2% below last year but 13% above the 30YA. The reporting rate increased steadily from 2002 to 2014 but has declined in the last three years. Average 8.1, median 4 with max (roost flight) 222/29 Mar Exhibition Park GrL12 (LeM1). 46 breeding records (33 last year): first ih/12 Aug Callum Brae NR (HeS1) and last 27 Jan Ginninderra Ck Latham (KiB1) with an early start to next season ih/25 Jun Wanniassa Hills NR (BaL1).
GBS: Records of up to 40 individuals from 36 sites from all weeks (29% in summer). Average 4.9, median 3 with max 40/2wk May Duffy (CaJ4). Abundance 12% higher than last year and 107% higher than the 30YA, steadily increasing from 2006. Breeding recorded from 2 sites (1 last year): earliest ih/3wk Aug and latest dy/4 wk Dec, both Curtin (AjR1).
Abundance
Abundance is the average number of birds of that species per survey. Where the species was observed (presence recorded) but the number of birds seen was not recorded, this is treated as a count of zero.
Abundance by year
This chart shows the abundance of Red-rumped Parrot between 1982 and 2017. 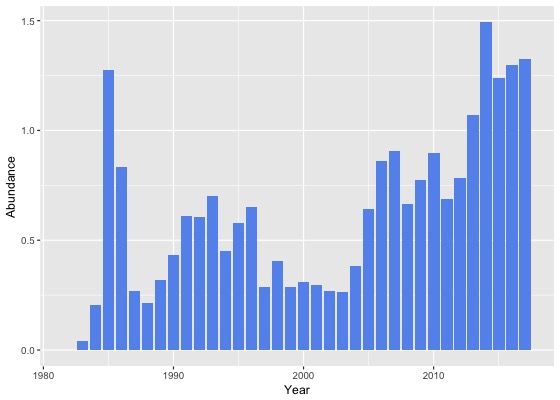
Abundance by month
This chart shows the monthly abundance of Red-rumped Parrot. The blue lines show the abundance for the twelve months to June 2017 and the bars show the average abundance for the period 1982 to 2017. 
Abundance by season
This chart shows the seasonal abundance of Red-rumped Parrot. The blue lines show the seasonal abundance for the twelve months to June 2017 and the bars show the average seasonal abundance for the period 1982 to 2017. 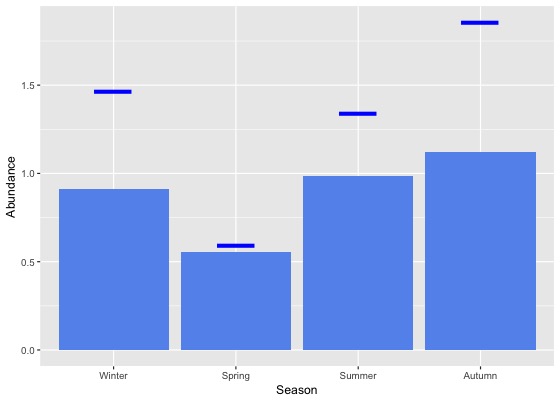
Abundance data
| Month | Season | ||||||||||||||||||
|---|---|---|---|---|---|---|---|---|---|---|---|---|---|---|---|---|---|---|---|
| Period | Jul | Aug | Sep | Oct | Nov | Dec | Jan | Feb | Mar | Apr | May | Jun | Winter | Spring | Summer | Autumn | All | ||
| All years | |||||||||||||||||||
| All | 0.9 | 0.9 | 0.5 | 0.6 | 0.6 | 0.7 | 1.1 | 1.2 | 1.0 | 1.1 | 1.4 | 1.0 | 0.9 | 0.6 | 1.0 | 1.1 | 0.9 | ||
| Previous years | |||||||||||||||||||
| All previous years | 0.8 | 0.7 | 0.5 | 0.5 | 0.6 | 0.6 | 1.1 | 1.1 | 0.8 | 1.0 | 1.2 | 0.9 | 0.8 | 0.5 | 0.9 | 1.0 | 0.8 | ||
| Previous 30 years | 0.8 | 0.7 | 0.5 | 0.5 | 0.6 | 0.6 | 1.1 | 1.1 | 0.8 | 0.9 | 1.3 | 0.9 | 0.8 | 0.5 | 0.9 | 1.0 | 0.8 | ||
| Previous 20 years | 0.9 | 0.9 | 0.6 | 0.6 | 0.7 | 0.7 | 1.2 | 1.2 | 0.9 | 1.0 | 1.4 | 1.0 | 0.9 | 0.6 | 1.0 | 1.1 | 0.9 | ||
| 10 year groups | |||||||||||||||||||
| [2007,2017) | 1.2 | 1.1 | 0.7 | 0.7 | 0.9 | 0.9 | 1.3 | 1.4 | 1.1 | 1.2 | 1.8 | 1.3 | 1.2 | 0.7 | 1.2 | 1.3 | 1.1 | ||
| [1997,2007) | 0.4 | 0.2 | 0.3 | 0.2 | 0.3 | 0.3 | 0.7 | 0.6 | 0.5 | 0.5 | 0.5 | 0.5 | 0.4 | 0.3 | 0.5 | 0.5 | 0.4 | ||
| [1987,1997) | 0.3 | 0.3 | 0.3 | 0.3 | 0.2 | 0.4 | 0.5 | 0.7 | 0.6 | 0.6 | 0.6 | 0.4 | 0.3 | 0.3 | 0.5 | 0.6 | 0.4 | ||
| 5 year groups | |||||||||||||||||||
| [2012,2017) | 1.4 | 1.2 | 0.8 | 0.7 | 1.0 | 1.1 | 1.3 | 1.4 | 1.2 | 1.4 | 2.2 | 1.4 | 1.3 | 0.8 | 1.3 | 1.5 | 1.2 | ||
| [2007,2012) | 0.8 | 0.9 | 0.5 | 0.6 | 0.6 | 0.5 | 1.4 | 1.2 | 0.8 | 0.9 | 0.9 | 0.9 | 0.9 | 0.6 | 1.0 | 0.9 | 0.8 | ||
| [2002,2007) | 0.4 | 0.2 | 0.3 | 0.2 | 0.3 | 0.3 | 0.9 | 0.9 | 0.6 | 0.7 | 0.6 | 0.6 | 0.4 | 0.3 | 0.6 | 0.7 | 0.5 | ||
| [1997,2002) | 0.4 | 0.2 | 0.3 | 0.2 | 0.3 | 0.3 | 0.4 | 0.3 | 0.3 | 0.2 | 0.4 | 0.4 | 0.4 | 0.3 | 0.3 | 0.3 | 0.3 | ||
| [1992,1997) | 0.5 | 0.5 | 0.3 | 0.4 | 0.2 | 0.5 | 0.9 | 1.1 | 1.0 | 0.7 | 1.0 | 0.4 | 0.5 | 0.3 | 0.8 | 0.9 | 0.6 | ||
| [1987,1992) | 0.2 | 0.2 | 0.2 | 0.3 | 0.2 | 0.3 | 0.3 | 0.6 | 0.3 | 0.5 | 0.4 | 0.4 | 0.3 | 0.2 | 0.4 | 0.4 | 0.3 | ||
| Year | |||||||||||||||||||
| 2017 | 1.5 | 1.5 | 0.5 | 0.6 | 0.6 | 1.0 | 1.5 | 1.5 | 2.0 | 1.7 | 1.8 | 1.4 | 1.5 | 0.6 | 1.3 | 1.9 | 1.3 | ||
| 2016 | 1.3 | 1.1 | 0.9 | 0.9 | 1.0 | 1.0 | 1.4 | 1.4 | 1.6 | 1.3 | 2.2 | 1.6 | 1.3 | 0.9 | 1.3 | 1.6 | 1.3 | ||
| 2015 | 1.6 | 1.6 | 1.1 | 0.8 | 1.0 | 1.2 | 1.2 | 1.3 | 0.8 | 1.5 | 2.2 | 1.4 | 1.5 | 0.9 | 1.2 | 1.4 | 1.2 | ||
| 2014 | 1.9 | 1.6 | 0.6 | 0.8 | 1.1 | 1.3 | 1.9 | 2.2 | 1.7 | 1.4 | 2.4 | 1.4 | 1.6 | 0.8 | 1.9 | 1.8 | 1.5 | ||
| 2013 | 1.2 | 0.8 | 0.5 | 0.6 | 1.3 | 1.0 | 1.1 | 1.2 | 0.9 | 1.2 | 2.4 | 1.8 | 1.3 | 0.8 | 1.1 | 1.3 | 1.1 | ||
| 2012 | 0.9 | 0.6 | 0.6 | 0.5 | 0.8 | 0.9 | 0.9 | 0.8 | 0.3 | 1.3 | 1.2 | 1.0 | 0.9 | 0.6 | 0.9 | 0.9 | 0.8 | ||
| 2011 | 1.0 | 1.5 | 0.5 | 0.7 | 0.5 | 0.3 | 0.8 | 0.5 | 0.6 | 0.9 | 0.3 | 1.2 | 1.2 | 0.6 | 0.5 | 0.6 | 0.7 | ||
| 2010 | 0.7 | 0.5 | 0.6 | 0.5 | 0.8 | 0.9 | 1.3 | 2.6 | 0.8 | 0.9 | 1.5 | 1.1 | 0.9 | 0.6 | 1.3 | 1.0 | 0.9 | ||
| 2009 | 0.3 | 1.3 | 0.5 | 0.6 | 0.4 | 0.7 | 1.8 | 1.8 | 1.1 | 0.7 | 0.6 | 0.7 | 0.7 | 0.5 | 1.4 | 0.8 | 0.8 | ||
| 2008 | 0.4 | 1.0 | 0.4 | 0.5 | 0.5 | 0.6 | 1.9 | 0.6 | 1.1 | 0.5 | 1.2 | 0.7 | 0.7 | 0.5 | 0.9 | 0.8 | 0.7 | ||
| 2007 | 1.6 | 0.1 | 0.7 | 0.7 | 0.5 | 0.4 | 1.7 | 1.2 | 0.4 | 1.7 | 1.7 | 0.8 | 0.8 | 0.7 | 1.0 | 1.2 | 0.9 | ||
| 2006 | 0.8 | 0.2 | 0.4 | 0.4 | 0.3 | 0.7 | 2.0 | 2.4 | 0.7 | 1.5 | 0.8 | 0.9 | 0.7 | 0.4 | 1.7 | 0.9 | 0.9 | ||
| 2005 | 0.4 | 0.3 | 0.3 | 0.3 | 0.5 | 0.5 | 1.0 | 1.9 | 1.0 | 0.2 | 1.1 | 0.8 | 0.6 | 0.3 | 0.9 | 0.8 | 0.6 | ||
| 2004 | 0.3 | 0.2 | 0.2 | 0.1 | 0.1 | 0.2 | 0.6 | 0.4 | 1.1 | 0.6 | 0.3 | 0.5 | 0.3 | 0.1 | 0.4 | 0.8 | 0.4 | ||
| 2003 | 0.1 | 0.2 | 0.4 | 0.1 | 0.3 | 0.1 | 0.2 | 0.2 | 0.2 | 0.6 | 0.1 | 0.4 | 0.3 | 0.3 | 0.2 | 0.3 | 0.3 | ||
| 2002 | 0.5 | 0.2 | 0.1 | 0.1 | 0.3 | 0.3 | 0.3 | 0.3 | 0.3 | 0.6 | 0.1 | 0.2 | 0.3 | 0.2 | 0.3 | 0.3 | 0.3 | ||
| 2001 | 0.3 | 0.2 | 0.4 | 0.2 | 0.3 | 0.5 | 0.4 | 0.2 | 0.2 | 0.3 | 0.4 | 0.2 | 0.2 | 0.3 | 0.4 | 0.3 | 0.3 | ||
| 2000 | 0.6 | 0.3 | 0.2 | 0.1 | 0.4 | 0.2 | 0.4 | 0.4 | 0.4 | 0.3 | 0.3 | 0.3 | 0.4 | 0.2 | 0.3 | 0.3 | 0.3 | ||
| 1999 | 1.5 | 0.1 | 0.3 | 0.3 | 0.2 | 0.4 | 0.5 | 0.2 | 0.2 | 0.1 | 0.2 | 0.4 | 0.4 | 0.2 | 0.4 | 0.2 | 0.3 | ||
| 1998 | 0.1 | 0.4 | 0.7 | 0.0 | 0.3 | 0.2 | 0.4 | 0.1 | 0.2 | 0.3 | 0.6 | 1.5 | 0.8 | 0.4 | 0.2 | 0.3 | 0.4 | ||
| 1997 | 0.2 | 0.2 | 0.2 | 0.2 | 0.3 | 0.2 | 0.7 | 0.5 | 0.3 | 0.2 | 0.9 | 0.0 | 0.1 | 0.3 | 0.4 | 0.4 | 0.3 | ||
| 1996 | 0.4 | 0.3 | 0.5 | 0.7 | 0.2 | 0.4 | 1.6 | 1.0 | 0.2 | 0.7 | 0.9 | 0.8 | 0.5 | 0.5 | 1.0 | 0.5 | 0.6 | ||
| 1995 | 0.4 | 0.4 | 0.0 | 0.2 | 0.0 | 0.1 | 0.7 | 1.6 | 2.6 | 0.5 | 0.7 | 0.4 | 0.4 | 0.1 | 0.7 | 1.3 | 0.6 | ||
| 1994 | 0.8 | 0.9 | 0.4 | 0.4 | 0.2 | 0.4 | 0.5 | 0.6 | 0.1 | 0.4 | 1.0 | 0.2 | 0.6 | 0.3 | 0.5 | 0.5 | 0.4 | ||
| 1993 | 0.6 | 0.3 | 0.2 | 0.4 | 0.4 | 0.6 | 0.4 | 0.8 | 1.5 | 0.9 | 1.9 | 0.3 | 0.3 | 0.3 | 0.6 | 1.5 | 0.7 | ||
| 1992 | 0.6 | 0.4 | 0.4 | 0.4 | 0.3 | 1.3 | 0.8 | 1.2 | 0.5 | 1.3 | 0.3 | 0.3 | 0.4 | 0.4 | 1.1 | 0.7 | 0.6 | ||
| 1991 | 0.3 | 0.3 | 0.5 | 0.4 | 0.2 | 0.3 | 0.7 | 1.0 | 0.4 | 0.9 | 3.1 | 0.4 | 0.3 | 0.3 | 0.6 | 1.4 | 0.6 | ||
| 1990 | 0.2 | 0.2 | 0.1 | 0.1 | 0.1 | 0.2 | 0.4 | 0.3 | 1.2 | 1.4 | 0.4 | 1.3 | 0.4 | 0.1 | 0.3 | 1.0 | 0.4 | ||
| 1989 | 0.1 | 0.2 | 0.2 | 0.3 | 0.2 | 0.4 | 0.2 | 1.1 | 0.2 | 0.4 | 0.1 | 0.4 | 0.3 | 0.2 | 0.5 | 0.3 | 0.3 | ||
| 1988 | 0.1 | 0.2 | 0.3 | 0.2 | 0.2 | 0.3 | 0.2 | 0.2 | 0.2 | 0.4 | 0.2 | 0.2 | 0.2 | 0.2 | 0.2 | 0.2 | 0.2 | ||
| 1987 | 1.6 | 0.4 | 0.2 | 0.3 | 0.2 | 0.3 | 0.2 | 0.5 | 0.2 | 0.2 | 0.2 | 0.2 | 0.3 | 0.2 | 0.4 | 0.2 | 0.3 | ||
| 1986 | 0.0 | 0.4 | 0.2 | 1.5 | 0.2 | 0.6 | 1.0 | 2.8 | 0.4 | 1.8 | 0.3 | 0.5 | 0.4 | 0.5 | 1.5 | 1.0 | 0.8 | ||
| 1985 | 0.1 | 2.7 | 0.2 | 0.6 | 0.6 | 1.3 | 0.0 | 3.8 | 0.2 | 7.8 | 0.0 | 1.8 | 1.5 | 0.5 | 1.7 | 3.8 | 1.3 | ||
| 1984 | 0.0 | 0.0 | 0.0 | 0.0 | 0.0 | 0.0 | 0.5 | 0.1 | 0.7 | 0.4 | 0.0 | 0.0 | 0.0 | 0.0 | 0.2 | 0.3 | 0.2 | ||
| 1983 | 0.0 | 0.0 | 0.0 | 0.1 | 0.3 | 0.0 | 0.0 | 0.0 | 0.0 | - | 0.0 | 0.0 | 0.0 | 0.1 | 0.0 | 0.0 | 0.0 | ||
| 1982 | - | 0.0 | - | 0.0 | 0.0 | 0.0 | - | 0.0 | - | 0.0 | - | 0.0 | 0.0 | 0.0 | 0.0 | 0.0 | 0.0 | ||
Reporting rates
Reporting rate is the proportion of all surveys in which the species was present.
Reporting rate by year
This chart shows the reporting rate of Red-rumped Parrot each year between 1982 and 2017. 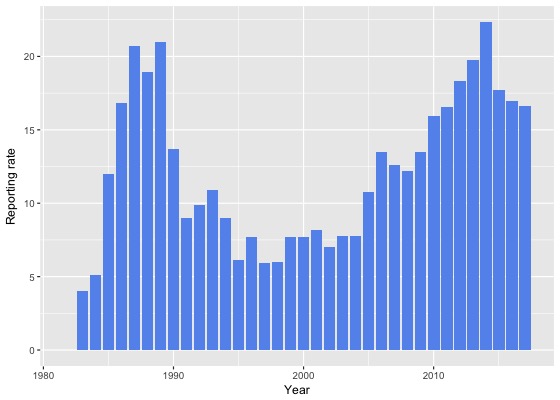
Reporting rate by month
This chart shows the reporting rate by month of Red-rumped Parrot. The blue lines show the reporting rate for the twelve months to June 2017 and the bars show the average reporting rate for the period 1982 to 2017. 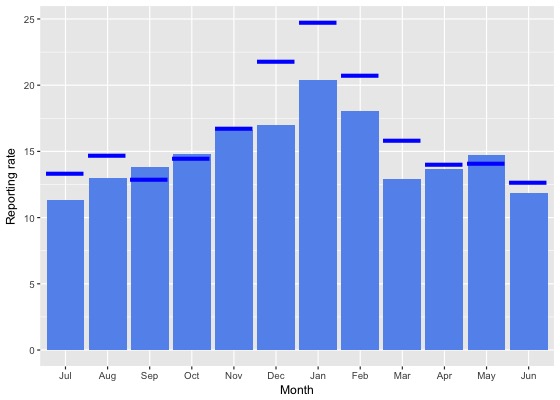
Reporting rate by season
This chart shows the seasonal reporting rate of Red-rumped Parrot. The blue lines show the seasonal reporting rate for the twelve months to June 2017 and the bars show the average seasonal reporting rate for the period 1982 to 2017. 
Reporting rate data
| Month | Season | ||||||||||||||||||
|---|---|---|---|---|---|---|---|---|---|---|---|---|---|---|---|---|---|---|---|
| Period | Jul | Aug | Sep | Oct | Nov | Dec | Jan | Feb | Mar | Apr | May | Jun | Winter | Spring | Summer | Autumn | All | ||
| All years | |||||||||||||||||||
| All | 11.3 | 13.0 | 13.8 | 14.8 | 16.6 | 17.0 | 20.4 | 18.0 | 12.9 | 13.7 | 14.7 | 11.9 | 12.1 | 15.0 | 18.5 | 13.7 | 15.0 | ||
| Previous years | |||||||||||||||||||
| All previous years | 11.0 | 12.7 | 13.9 | 14.8 | 16.6 | 16.3 | 19.5 | 17.5 | 12.4 | 13.6 | 14.8 | 11.7 | 11.8 | 15.0 | 17.8 | 13.5 | 14.7 | ||
| Previous 30 years | 11.1 | 12.7 | 14.0 | 14.8 | 16.7 | 16.4 | 19.6 | 17.5 | 12.4 | 13.6 | 14.9 | 11.8 | 11.9 | 15.1 | 17.9 | 13.5 | 14.7 | ||
| Previous 20 years | 11.0 | 12.6 | 13.9 | 14.7 | 17.6 | 16.3 | 20.1 | 17.2 | 11.9 | 13.3 | 14.9 | 11.4 | 11.6 | 15.2 | 17.9 | 13.1 | 14.7 | ||
| 10 year groups | |||||||||||||||||||
| [2007,2017) | 13.7 | 15.7 | 16.1 | 16.4 | 21.5 | 19.6 | 22.6 | 20.4 | 14.1 | 15.1 | 17.5 | 13.5 | 14.2 | 17.5 | 21.0 | 15.3 | 17.3 | ||
| [1997,2007) | 6.3 | 5.8 | 9.6 | 8.7 | 9.6 | 9.9 | 12.0 | 8.9 | 7.1 | 8.5 | 8.6 | 7.0 | 6.5 | 9.3 | 10.3 | 8.0 | 8.6 | ||
| [1987,1997) | 11.5 | 13.1 | 14.5 | 15.7 | 13.6 | 16.9 | 16.5 | 19.0 | 14.9 | 15.3 | 15.1 | 13.9 | 12.9 | 14.6 | 17.4 | 15.1 | 15.0 | ||
| 5 year groups | |||||||||||||||||||
| [2012,2017) | 14.7 | 16.2 | 17.1 | 18.3 | 23.6 | 22.5 | 23.1 | 20.6 | 15.1 | 16.1 | 17.0 | 14.1 | 14.9 | 19.3 | 22.2 | 15.9 | 18.5 | ||
| [2007,2012) | 10.9 | 13.6 | 13.8 | 13.2 | 15.9 | 13.4 | 20.5 | 19.3 | 11.6 | 12.9 | 18.9 | 12.5 | 12.4 | 13.8 | 17.2 | 13.7 | 14.3 | ||
| [2002,2007) | 6.6 | 6.8 | 10.5 | 10.1 | 10.2 | 10.1 | 13.9 | 9.8 | 8.0 | 10.8 | 8.7 | 7.6 | 7.0 | 10.3 | 11.2 | 9.1 | 9.5 | ||
| [1997,2002) | 5.9 | 4.7 | 8.4 | 6.7 | 9.0 | 9.6 | 9.9 | 8.0 | 5.9 | 5.8 | 8.5 | 6.1 | 5.7 | 8.1 | 9.2 | 6.5 | 7.5 | ||
| [1992,1997) | 8.6 | 6.9 | 6.6 | 9.2 | 8.3 | 11.1 | 9.2 | 9.0 | 10.2 | 5.7 | 10.9 | 5.8 | 7.0 | 8.2 | 9.8 | 8.8 | 8.4 | ||
| [1987,1992) | 12.8 | 16.5 | 18.2 | 19.3 | 16.2 | 19.4 | 20.6 | 22.9 | 17.7 | 20.8 | 17.3 | 18.4 | 15.9 | 17.9 | 20.9 | 18.6 | 18.3 | ||
| Year | |||||||||||||||||||
| 2017 | 13.4 | 14.7 | 12.9 | 14.5 | 16.7 | 21.8 | 24.7 | 20.7 | 15.9 | 14.0 | 14.1 | 12.7 | 13.5 | 14.7 | 22.6 | 14.7 | 16.6 | ||
| 2016 | 12.3 | 13.6 | 15.8 | 18.2 | 18.9 | 19.3 | 19.5 | 20.0 | 16.3 | 16.6 | 16.7 | 12.6 | 12.9 | 17.6 | 19.6 | 16.5 | 17.0 | ||
| 2015 | 14.9 | 16.6 | 18.9 | 19.4 | 22.2 | 22.3 | 18.6 | 18.7 | 12.7 | 16.0 | 15.2 | 14.9 | 15.4 | 20.0 | 19.8 | 14.6 | 17.7 | ||
| 2014 | 17.6 | 16.4 | 14.5 | 20.9 | 26.7 | 27.9 | 34.0 | 25.8 | 19.8 | 16.9 | 21.7 | 15.1 | 16.0 | 20.2 | 30.4 | 19.3 | 22.3 | ||
| 2013 | 12.7 | 19.0 | 17.5 | 15.6 | 33.6 | 25.4 | 26.6 | 20.8 | 14.1 | 13.3 | 18.4 | 15.2 | 15.6 | 21.0 | 24.8 | 14.7 | 19.8 | ||
| 2012 | 20.2 | 21.7 | 19.1 | 17.1 | 23.2 | 21.8 | 21.2 | 20.0 | 10.4 | 16.8 | 14.4 | 13.3 | 17.9 | 19.1 | 21.2 | 13.9 | 18.4 | ||
| 2011 | 13.0 | 16.8 | 13.2 | 16.6 | 13.9 | 12.5 | 23.7 | 18.7 | 11.9 | 18.2 | 24.0 | 14.0 | 14.4 | 15.1 | 18.3 | 17.7 | 16.6 | ||
| 2010 | 11.5 | 14.0 | 16.5 | 12.0 | 19.1 | 20.0 | 21.3 | 32.9 | 13.0 | 13.2 | 17.6 | 13.4 | 13.1 | 14.8 | 22.4 | 13.9 | 16.0 | ||
| 2009 | 12.2 | 21.9 | 14.7 | 12.9 | 11.6 | 13.8 | 17.3 | 18.3 | 13.5 | 13.1 | 10.7 | 9.0 | 12.7 | 13.1 | 16.1 | 12.7 | 13.5 | ||
| 2008 | 8.3 | 10.4 | 13.9 | 12.2 | 18.8 | 12.2 | 23.8 | 13.9 | 10.2 | 6.8 | 11.7 | 11.2 | 10.1 | 13.6 | 15.8 | 8.7 | 12.2 | ||
| 2007 | 9.9 | 5.6 | 10.4 | 12.2 | 16.9 | 9.1 | 15.7 | 16.5 | 8.9 | 13.2 | 23.6 | 13.4 | 11.1 | 12.5 | 12.9 | 13.7 | 12.6 | ||
| 2006 | 10.5 | 12.6 | 14.1 | 11.3 | 8.9 | 14.5 | 26.4 | 22.2 | 8.5 | 17.2 | 9.4 | 13.0 | 12.2 | 11.6 | 20.9 | 11.1 | 13.5 | ||
| 2005 | 6.6 | 5.6 | 10.0 | 12.7 | 11.7 | 11.6 | 16.3 | 12.0 | 11.7 | 6.0 | 13.9 | 9.9 | 8.1 | 11.3 | 13.0 | 10.7 | 10.8 | ||
| 2004 | 4.8 | 5.3 | 9.6 | 7.6 | 8.7 | 8.8 | 8.5 | 7.1 | 9.3 | 10.4 | 9.7 | 4.3 | 4.8 | 8.7 | 8.3 | 9.8 | 7.8 | ||
| 2003 | 3.4 | 7.9 | 10.6 | 11.4 | 12.4 | 7.6 | 6.7 | 5.5 | 4.9 | 11.1 | 2.3 | 3.7 | 5.0 | 11.4 | 6.7 | 6.7 | 7.8 | ||
| 2002 | 8.0 | 3.4 | 8.0 | 6.9 | 9.0 | 9.4 | 9.4 | 4.6 | 5.5 | 8.9 | 3.5 | 2.7 | 4.8 | 7.9 | 8.3 | 6.3 | 7.0 | ||
| 2001 | 6.2 | 4.2 | 8.6 | 6.3 | 15.3 | 15.2 | 9.0 | 7.2 | 4.5 | 7.8 | 7.5 | 5.9 | 5.6 | 9.5 | 11.0 | 6.2 | 8.1 | ||
| 2000 | 7.9 | 5.9 | 7.0 | 7.0 | 10.2 | 7.4 | 9.9 | 8.1 | 7.8 | 7.1 | 8.2 | 5.4 | 6.2 | 8.1 | 8.4 | 7.6 | 7.7 | ||
| 1999 | 5.9 | 5.2 | 10.9 | 6.9 | 6.5 | 10.0 | 12.4 | 7.9 | 5.9 | 3.6 | 7.4 | 8.9 | 7.5 | 8.2 | 10.1 | 5.6 | 7.7 | ||
| 1998 | 5.4 | 3.8 | 9.8 | 2.2 | 3.5 | 5.7 | 8.8 | 5.7 | 4.3 | 7.7 | 14.8 | 6.7 | 5.5 | 5.5 | 6.6 | 6.9 | 6.0 | ||
| 1997 | 2.3 | 3.4 | 5.5 | 11.8 | 6.0 | 4.8 | 7.8 | 12.3 | 10.0 | 2.8 | 13.3 | 0.0 | 1.8 | 7.3 | 7.5 | 6.7 | 5.9 | ||
| 1996 | 9.0 | 4.3 | 5.3 | 14.9 | 5.6 | 9.1 | 7.8 | 4.7 | 4.9 | 4.7 | 8.6 | 11.5 | 8.1 | 9.1 | 7.3 | 5.8 | 7.7 | ||
| 1995 | 6.5 | 3.9 | 1.0 | 4.9 | 2.7 | 6.9 | 8.0 | 9.5 | 15.3 | 5.6 | 10.4 | 3.2 | 4.4 | 3.2 | 8.0 | 10.0 | 6.1 | ||
| 1994 | 11.8 | 15.6 | 11.8 | 11.6 | 12.5 | 6.5 | 5.9 | 6.9 | 3.4 | 5.3 | 10.0 | 6.7 | 11.1 | 12.1 | 6.4 | 6.0 | 9.0 | ||
| 1993 | 10.2 | 7.7 | 8.1 | 10.7 | 12.1 | 17.4 | 12.2 | 15.6 | 16.0 | 3.3 | 15.6 | 4.3 | 7.1 | 10.3 | 15.0 | 12.4 | 10.9 | ||
| 1992 | 7.7 | 5.6 | 9.4 | 6.4 | 9.7 | 19.0 | 15.5 | 14.6 | 12.7 | 10.2 | 9.2 | 1.7 | 5.0 | 8.4 | 16.7 | 10.7 | 9.9 | ||
| 1991 | 3.9 | 9.6 | 7.0 | 7.8 | 3.1 | 5.4 | 8.9 | 20.0 | 12.7 | 11.9 | 21.3 | 10.0 | 7.0 | 5.9 | 10.6 | 15.3 | 9.0 | ||
| 1990 | 16.1 | 11.9 | 8.6 | 11.2 | 14.0 | 13.9 | 22.2 | 12.7 | 15.9 | 17.9 | 9.6 | 11.8 | 13.5 | 11.4 | 16.3 | 14.7 | 13.7 | ||
| 1989 | 15.3 | 19.4 | 17.0 | 19.6 | 21.2 | 22.6 | 22.3 | 26.8 | 20.6 | 26.2 | 13.8 | 27.4 | 20.3 | 19.2 | 23.9 | 20.7 | 21.0 | ||
| 1988 | 12.9 | 20.1 | 27.0 | 18.8 | 17.0 | 20.0 | 18.1 | 20.6 | 15.8 | 22.5 | 19.7 | 17.9 | 17.1 | 20.1 | 19.5 | 19.3 | 18.9 | ||
| 1987 | 18.2 | 6.7 | 20.6 | 27.3 | 17.0 | 22.3 | 24.1 | 25.0 | 19.1 | 18.5 | 18.8 | 16.2 | 15.7 | 21.2 | 23.8 | 18.8 | 20.7 | ||
| 1986 | 7.7 | 13.2 | 9.4 | 25.0 | 12.8 | 20.6 | 17.4 | 27.8 | 19.4 | 21.6 | 24.1 | 5.7 | 9.1 | 14.7 | 22.6 | 21.6 | 16.9 | ||
| 1985 | 3.3 | 16.7 | 5.8 | 10.5 | 10.5 | 15.0 | 0.0 | 29.4 | 18.2 | 21.1 | 0.0 | 17.9 | 12.5 | 9.2 | 16.5 | 15.0 | 12.0 | ||
| 1984 | 0.0 | 0.0 | 0.0 | 0.0 | 0.0 | 0.0 | 17.2 | 3.0 | 7.4 | 8.8 | 3.2 | 0.0 | 0.0 | 0.0 | 8.1 | 6.5 | 5.1 | ||
| 1983 | 0.0 | 0.0 | 0.0 | 7.7 | 33.3 | 0.0 | 0.0 | 0.0 | 0.0 | - | 0.0 | 0.0 | 0.0 | 14.8 | 0.0 | 0.0 | 4.0 | ||
| 1982 | - | 0.0 | - | 0.0 | 0.0 | 0.0 | - | 0.0 | - | 0.0 | - | 0.0 | 0.0 | 0.0 | 0.0 | 0.0 | 0.0 | ||
Breeding data
Breeding records by month
Number of breeding records by breeding code and month, 2017 and all years| Breeding code | Jul | Aug | Sep | Oct | Nov | Dec | Jan | Feb | Mar | Apr | May | Jun |
|---|---|---|---|---|---|---|---|---|---|---|---|---|
| 2017 | ||||||||||||
| Breeding (BLA code) | 0 | 0 | 0 | 0 | 0 | 0 | 0 | 0 | 0 | 0 | 0 | 0 |
| Carrying Food | 0 | 0 | 0 | 0 | 0 | 0 | 0 | 0 | 0 | 0 | 0 | 0 |
| Copulating | 0 | 0 | 0 | 0 | 0 | 0 | 0 | 0 | 0 | 0 | 0 | 0 |
| Display | 0 | 0 | 1 | 1 | 0 | 0 | 0 | 0 | 0 | 0 | 0 | 0 |
| Dependent young | 0 | 1 | 0 | 0 | 2 | 5 | 5 | 0 | 0 | 0 | 0 | 0 |
| Faecal sac | 0 | 0 | 0 | 0 | 0 | 0 | 0 | 0 | 0 | 0 | 0 | 0 |
| Inspecting hollow | 0 | 3 | 5 | 10 | 0 | 0 | 1 | 0 | 0 | 0 | 0 | 1 |
| Nest building | 0 | 0 | 0 | 0 | 0 | 0 | 0 | 0 | 0 | 0 | 0 | 0 |
| Nest with eggs | 0 | 0 | 0 | 0 | 0 | 0 | 0 | 0 | 0 | 0 | 0 | 0 |
| Nest with young | 0 | 0 | 0 | 0 | 0 | 0 | 0 | 0 | 0 | 0 | 0 | 0 |
| On/leaving nest | 0 | 1 | 4 | 4 | 2 | 0 | 0 | 0 | 0 | 0 | 0 | 0 |
| All years | ||||||||||||
| Breeding (BLA code) | 0 | 1 | 0 | 1 | 0 | 0 | 2 | 0 | 0 | 0 | 0 | 0 |
| Carrying Food | 0 | 0 | 0 | 0 | 0 | 0 | 0 | 0 | 0 | 0 | 0 | 0 |
| Copulating | 0 | 0 | 0 | 0 | 0 | 0 | 0 | 0 | 0 | 0 | 0 | 0 |
| Display | 0 | 0 | 1 | 3 | 1 | 0 | 0 | 0 | 0 | 0 | 1 | 0 |
| Dependent young | 0 | 1 | 4 | 8 | 19 | 41 | 25 | 12 | 0 | 0 | 1 | 0 |
| Faecal sac | 0 | 0 | 0 | 0 | 0 | 0 | 0 | 0 | 0 | 0 | 0 | 0 |
| Inspecting hollow | 3 | 15 | 37 | 51 | 13 | 10 | 2 | 0 | 2 | 0 | 0 | 5 |
| Nest building | 0 | 0 | 2 | 5 | 3 | 3 | 0 | 0 | 0 | 0 | 0 | 0 |
| Nest with eggs | 0 | 0 | 0 | 1 | 0 | 0 | 0 | 0 | 0 | 0 | 0 | 0 |
| Nest with young | 0 | 0 | 2 | 1 | 3 | 2 | 0 | 0 | 0 | 0 | 0 | 0 |
| On/leaving nest | 0 | 1 | 8 | 22 | 7 | 2 | 2 | 0 | 0 | 1 | 0 | 1 |
Breeding records by year
Average number of breeding records per period by breeding code| Period | Breeding (BLA code) | Carrying Food | Copulating | Display | Dependent young | Faecal sac | Inspecting hollow | Nest building | Nest with eggs | Nest with young | On/leaving nest |
|---|---|---|---|---|---|---|---|---|---|---|---|
| All years | |||||||||||
| All | 0.1 | 0.0 | 0.0 | 0.2 | 3.1 | 0.0 | 3.8 | 0.4 | 0.0 | 0.2 | 1.2 |
| Previous years | |||||||||||
| All previous years | 0.1 | 0.0 | 0.0 | 0.1 | 2.8 | 0.0 | 3.4 | 0.4 | 0.0 | 0.2 | 0.9 |
| Previous 30 years | 0.1 | 0.0 | 0.0 | 0.1 | 3.3 | 0.0 | 3.9 | 0.4 | 0.0 | 0.3 | 1.1 |
| Previous 20 years | 0.2 | 0.0 | 0.0 | 0.2 | 3.8 | 0.0 | 5.7 | 0.0 | 0.0 | 0.2 | 1.6 |
| 10 year groups | |||||||||||
| [2007,2017) | 0.3 | 0.0 | 0.0 | 0.2 | 6.6 | 0.0 | 8.6 | 0.1 | 0.1 | 0.3 | 2.5 |
| [1997,2007) | 0.1 | 0.0 | 0.0 | 0.2 | 1.0 | 0.0 | 2.7 | 0.0 | 0.0 | 0.2 | 0.6 |
| [1987,1997) | 0.0 | 0.0 | 0.0 | 0.0 | 2.2 | 0.0 | 0.5 | 1.1 | 0.0 | 0.3 | 0.2 |
| 5 year groups | |||||||||||
| [2012,2017) | 0.6 | 0.0 | 0.0 | 0.2 | 11.0 | 0.0 | 11.2 | 0.0 | 0.0 | 0.0 | 3.4 |
| [2007,2012) | 0.0 | 0.0 | 0.0 | 0.2 | 2.2 | 0.0 | 6.0 | 0.2 | 0.2 | 0.6 | 1.6 |
| [2002,2007) | 0.2 | 0.0 | 0.0 | 0.4 | 1.6 | 0.0 | 3.4 | 0.0 | 0.0 | 0.0 | 0.2 |
| [1997,2002) | 0.0 | 0.0 | 0.0 | 0.0 | 0.4 | 0.0 | 2.0 | 0.0 | 0.0 | 0.4 | 1.0 |
| [1992,1997) | 0.0 | 0.0 | 0.0 | 0.0 | 1.4 | 0.0 | 0.8 | 0.0 | 0.0 | 0.0 | 0.4 |
| [1987,1992) | 0.0 | 0.0 | 0.0 | 0.0 | 3.0 | 0.0 | 0.2 | 2.2 | 0.0 | 0.6 | 0.0 |
| Year | |||||||||||
| 2017 | 0.0 | 0.0 | 0.0 | 2.0 | 13.0 | 0.0 | 20.0 | 0.0 | 0.0 | 0.0 | 11.0 |
| 2016 | 0.0 | 0.0 | 0.0 | 0.0 | 12.0 | 0.0 | 15.0 | 0.0 | 0.0 | 0.0 | 6.0 |
| 2015 | 0.0 | 0.0 | 0.0 | 0.0 | 20.0 | 0.0 | 8.0 | 0.0 | 0.0 | 0.0 | 5.0 |
| 2014 | 0.0 | 0.0 | 0.0 | 1.0 | 16.0 | 0.0 | 13.0 | 0.0 | 0.0 | 0.0 | 1.0 |
| 2013 | 0.0 | 0.0 | 0.0 | 0.0 | 5.0 | 0.0 | 15.0 | 0.0 | 0.0 | 0.0 | 3.0 |
| 2012 | 3.0 | 0.0 | 0.0 | 0.0 | 2.0 | 0.0 | 5.0 | 0.0 | 0.0 | 0.0 | 2.0 |
| 2011 | 0.0 | 0.0 | 0.0 | 0.0 | 2.0 | 0.0 | 5.0 | 0.0 | 0.0 | 1.0 | 1.0 |
| 2010 | 0.0 | 0.0 | 0.0 | 0.0 | 3.0 | 0.0 | 11.0 | 1.0 | 0.0 | 1.0 | 3.0 |
| 2009 | 0.0 | 0.0 | 0.0 | 0.0 | 3.0 | 0.0 | 7.0 | 0.0 | 1.0 | 0.0 | 1.0 |
| 2008 | 0.0 | 0.0 | 0.0 | 0.0 | 2.0 | 0.0 | 2.0 | 0.0 | 0.0 | 1.0 | 2.0 |
| 2007 | 0.0 | 0.0 | 0.0 | 1.0 | 1.0 | 0.0 | 5.0 | 0.0 | 0.0 | 0.0 | 1.0 |
| 2006 | 0.0 | 0.0 | 0.0 | 1.0 | 4.0 | 0.0 | 5.0 | 0.0 | 0.0 | 0.0 | 1.0 |
| 2005 | 0.0 | 0.0 | 0.0 | 0.0 | 1.0 | 0.0 | 4.0 | 0.0 | 0.0 | 0.0 | 0.0 |
| 2004 | 0.0 | 0.0 | 0.0 | 1.0 | 0.0 | 0.0 | 3.0 | 0.0 | 0.0 | 0.0 | 0.0 |
| 2003 | 0.0 | 0.0 | 0.0 | 0.0 | 1.0 | 0.0 | 4.0 | 0.0 | 0.0 | 0.0 | 0.0 |
| 2002 | 1.0 | 0.0 | 0.0 | 0.0 | 2.0 | 0.0 | 1.0 | 0.0 | 0.0 | 0.0 | 0.0 |
| 2001 | 0.0 | 0.0 | 0.0 | 0.0 | 0.0 | 0.0 | 4.0 | 0.0 | 0.0 | 1.0 | 1.0 |
| 2000 | 0.0 | 0.0 | 0.0 | 0.0 | 0.0 | 0.0 | 1.0 | 0.0 | 0.0 | 1.0 | 2.0 |
| 1999 | 0.0 | 0.0 | 0.0 | 0.0 | 2.0 | 0.0 | 2.0 | 0.0 | 0.0 | 0.0 | 0.0 |
| 1998 | 0.0 | 0.0 | 0.0 | 0.0 | 0.0 | 0.0 | 1.0 | 0.0 | 0.0 | 0.0 | 1.0 |
| 1997 | 0.0 | 0.0 | 0.0 | 0.0 | 0.0 | 0.0 | 2.0 | 0.0 | 0.0 | 0.0 | 1.0 |
| 1996 | 0.0 | 0.0 | 0.0 | 0.0 | 4.0 | 0.0 | 2.0 | 0.0 | 0.0 | 0.0 | 1.0 |
| 1995 | 0.0 | 0.0 | 0.0 | 0.0 | 1.0 | 0.0 | 0.0 | 0.0 | 0.0 | 0.0 | 0.0 |
| 1994 | 0.0 | 0.0 | 0.0 | 0.0 | 1.0 | 0.0 | 1.0 | 0.0 | 0.0 | 0.0 | 1.0 |
| 1993 | 0.0 | 0.0 | 0.0 | 0.0 | 0.0 | 0.0 | 0.0 | 0.0 | 0.0 | 0.0 | 0.0 |
| 1992 | 0.0 | 0.0 | 0.0 | 0.0 | 1.0 | 0.0 | 1.0 | 0.0 | 0.0 | 0.0 | 0.0 |
| 1991 | 0.0 | 0.0 | 0.0 | 0.0 | 0.0 | 0.0 | 1.0 | 0.0 | 0.0 | 0.0 | 0.0 |
| 1990 | 0.0 | 0.0 | 0.0 | 0.0 | 2.0 | 0.0 | 0.0 | 0.0 | 0.0 | 0.0 | 0.0 |
| 1989 | 0.0 | 0.0 | 0.0 | 0.0 | 4.0 | 0.0 | 0.0 | 4.0 | 0.0 | 0.0 | 0.0 |
| 1988 | 0.0 | 0.0 | 0.0 | 0.0 | 5.0 | 0.0 | 0.0 | 2.0 | 0.0 | 1.0 | 0.0 |
| 1987 | 0.0 | 0.0 | 0.0 | 0.0 | 4.0 | 0.0 | 0.0 | 5.0 | 0.0 | 2.0 | 0.0 |
| 1986 | 0.0 | 0.0 | 0.0 | 0.0 | 0.0 | 0.0 | 0.0 | 1.0 | 0.0 | 0.0 | 0.0 |
| 1985 | 0.0 | 0.0 | 0.0 | 0.0 | 0.0 | 0.0 | 0.0 | 0.0 | 0.0 | 0.0 | 0.0 |
| 1984 | 0.0 | 0.0 | 0.0 | 0.0 | 0.0 | 0.0 | 0.0 | 0.0 | 0.0 | 0.0 | 0.0 |
| 1983 | 0.0 | 0.0 | 0.0 | 0.0 | 0.0 | 0.0 | 0.0 | 0.0 | 0.0 | 0.0 | 0.0 |
| 1982 | 0.0 | 0.0 | 0.0 | 0.0 | 0.0 | 0.0 | 0.0 | 0.0 | 0.0 | 0.0 | 0.0 |
Distribution map
Distribution - 2017
This map shows the observed distribution of the Red-rumped Parrot for 2017.
The red circles are the grid cells where Red-rumped Parrot have been reported.
The transparency of the red circles indicate how many surveys sheets were submitted for that grid cell; the darker the red the more reliable the data. Of the 315 grid cells with reports, 83 had only one sheet; an example is grid number M30.
The size of the circle represents the reporting rate. The maximum reporting rate for Red-rumped Parrot was 100.0% (eg grid number M30) and the minimum was 0.9% (eg grid number L25). 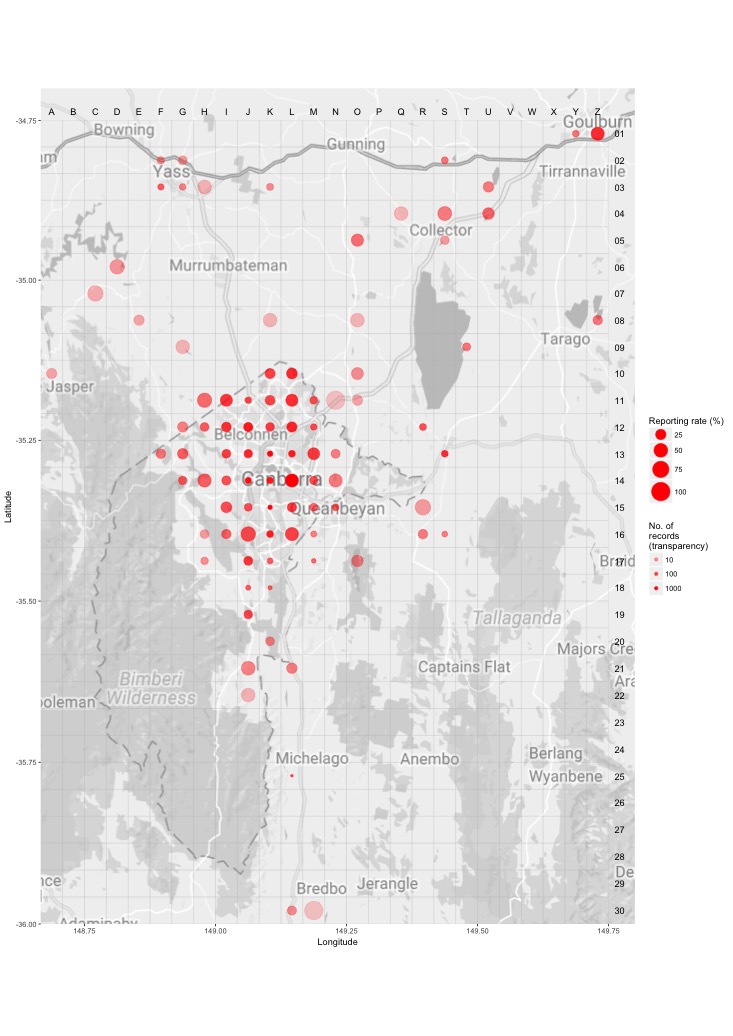
Distribution - all years
This map shows the observed distribution of the Red-rumped Parrot for all years.
The red circles are the grid cells where Red-rumped Parrot have been reported.
The transparency of the red circles indicate how many surveys sheets were submitted for that grid cell; the darker the red the more reliable the data. Of the 703 grid cells with reports, 55 had only one sheet; an example is grid number E29.
The size of the circle represents the reporting rate. The maximum reporting rate for Red-rumped Parrot was 100.0% (eg grid number E29) and the minimum was 0.3% (eg grid number Q12). 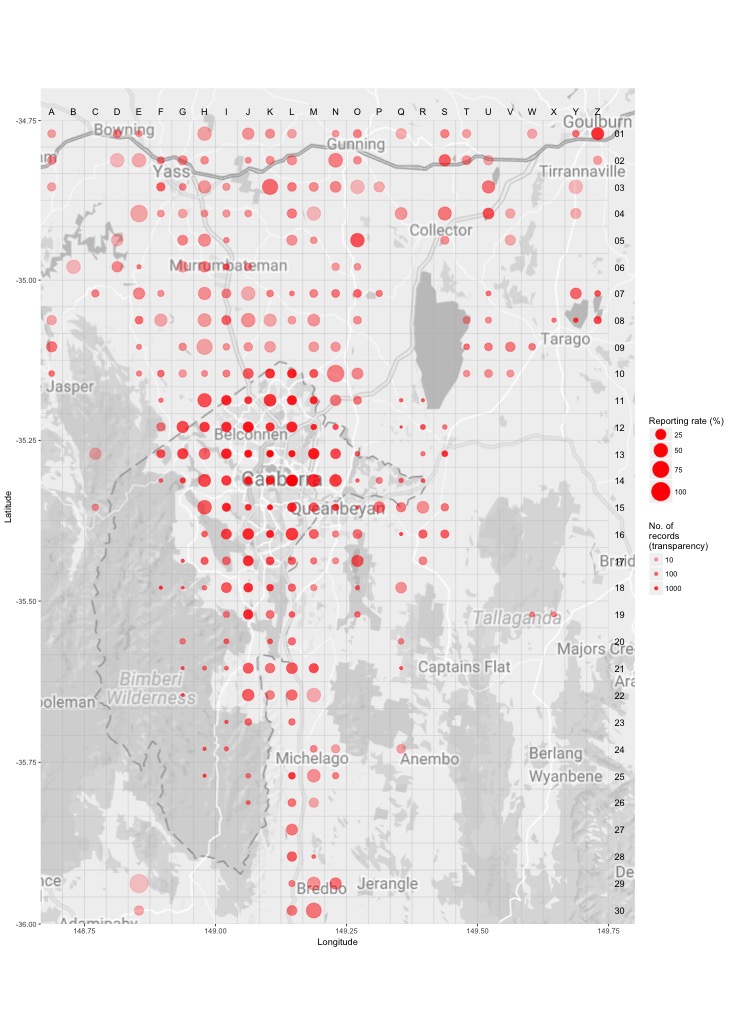
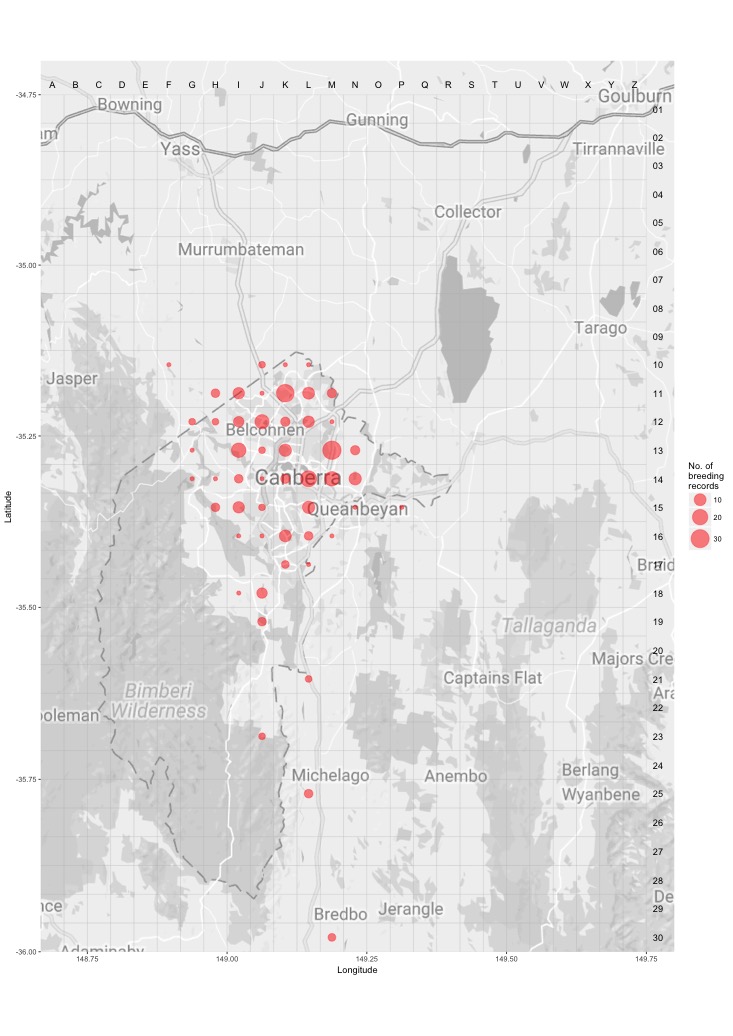
Breeding map
Breeding - 2017
This map shows the breeding distribution of the Red-rumped Parrot for 2017.
The red circles are the grid cells where breeding activity for Red-rumped Parrot have been reported.
The size of the circle represents the number of reports. 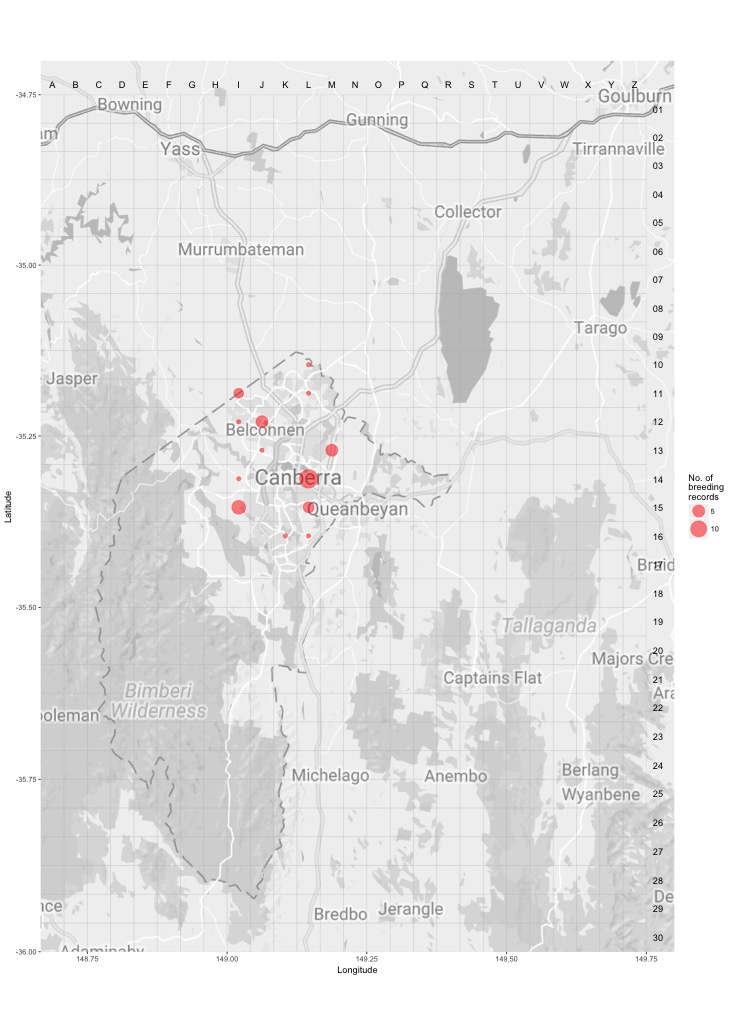
Breeding - all years
This map shows the breeding distribution of the Red-rumped Parrot for all years.
The red circles are the grid cells where breeding activity for Red-rumped Parrot have been reported.
The size of the circle represents the number of reports.